QA Hero: UX Leadership & Data Engineering for RMIT Course Quality
The Problem
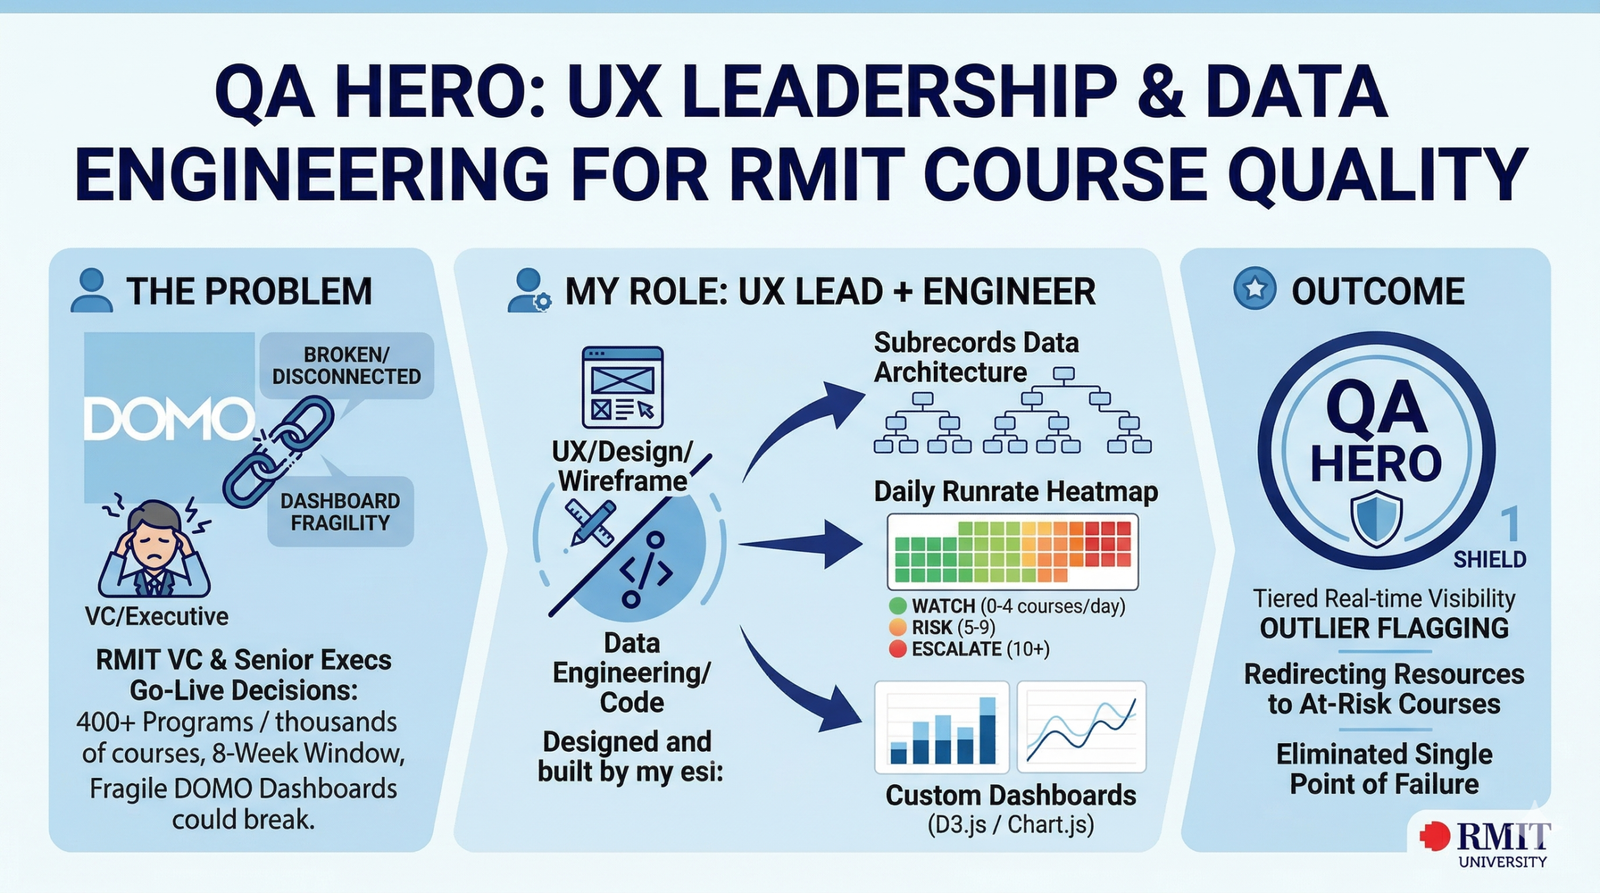
The problem wasn't just technical — it was coordinative. Four teams (BI, Learning Designers, Canvas LMS champs, and ITS) had to complete their work on thousands of courses within 8 weeks, with no unified view of where things stood. The VC and senior executives were making go-live decisions based on dashboards that could — and did — break under pressure.
The Subrecords problem compounded this: RMIT's course structure is genuinely unusual, with single course records spawning multiple shell types. The legacy system had no clean way to track QA status at the sub-record level — courses were falling through the cracks.
My Approach
On the UX side, I co-led the design of QA Hero's interface across three user tiers — College, School, and Transformation Team — each with different visibility needs. The Daily Runrate heatmap (Watch: 0–4 courses/day, Risk: 5–9, Escalate: 10+) gave every stakeholder an at-a-glance signal of where resources needed to go.
On the data engineering side, I designed the Subrecords architecture — a dedicated table storing non-standard course records with parent associations, populated by an automated job applying logic to SAMS extracts. For the DOMO migration, I designed and executed the full migration process: verifying completion, liaising with BI for database connection, validating data columns, replacing DOMO transforms, and running integrity checks.
The Work
Designed and co-led: QA Hero UX across three user tiers; Subrecords data architecture and automated population job; Daily Runrate heatmap with escalation thresholds; DOMO migration process and execution; custom D3.js and Chart.js dashboards replacing DOMO's proprietary transforms. Built on RMIT Vital Signs infrastructure (Magic ETL, SQL/RedShift ETLs, RAG timeliness dashboards, Workbench on Windows server farm with Non-Prod/Prod/DR instances).
Evidence of Impact
Delivered real-time QA visibility across 400+ RMIT programs during the critical 8-week pre-semester window. The outlier-flagging capability changed the team's operating mode from reactive to proactive — coordinators could redirect resources to courses most at risk of missing the go-live deadline before the deadline arrived. The custom dashboard migration eliminated the single point of failure that had threatened executive reporting continuity.
What I'd Do Differently
The DOMO migration checklist was thorough but sequential. I'd parallelise more verification steps to accelerate the migration. I'd also push for the D3.js rebuild earlier in the project lifecycle rather than as a risk mitigation measure — building on proprietary BI tooling when you have custom data requirements is a debt that compounds.